South Africa’s Water Quality: How Your City Ranks
Why this matters
Water is life — but not all South African cities deliver the same quality to their residents. The Department of Water and Sanitation’s 2023 Blue Drop Report is the country’s official water quality audit, assessing microbiological safety, chemical compliance, and infrastructure performance across municipalities.
For the first time since 2014, we have fresh national data to answer the question: How safe and reliable is your city’s water?
Source: Blue Drop National Report 2023 – Department of Water and Sanitation
The 2023 Blue Drop scoring system
Each municipality is scored out of 100%, based on:
- Microbiological compliance – Absence of harmful bacteria.
- Chemical compliance – Safe levels of metals, nitrates, chlorine, etc.
- Operational performance – Reliability of treatment, monitoring, and infrastructure.
A risk rating is also assigned:
- Low risk (green)
- Medium risk (yellow
- High risk (red)
City-by-city rankings
| Rank | City / Metro | Blue Drop Score | Risk Rating |
|---|---|---|---|
| 1 | Cape Town | 98.7% | Low |
| 2 | eThekwini (Durban) | 92.5% | Low |
| 3 | Nelson Mandela Bay | 89.1% | Low |
| 4 | Tshwane (Pretoria) | 86.4% | Medium |
| 5 | Ekurhuleni | 82.0% | Medium |
| 6 | Buffalo City (East London) | 78.3% | Medium |
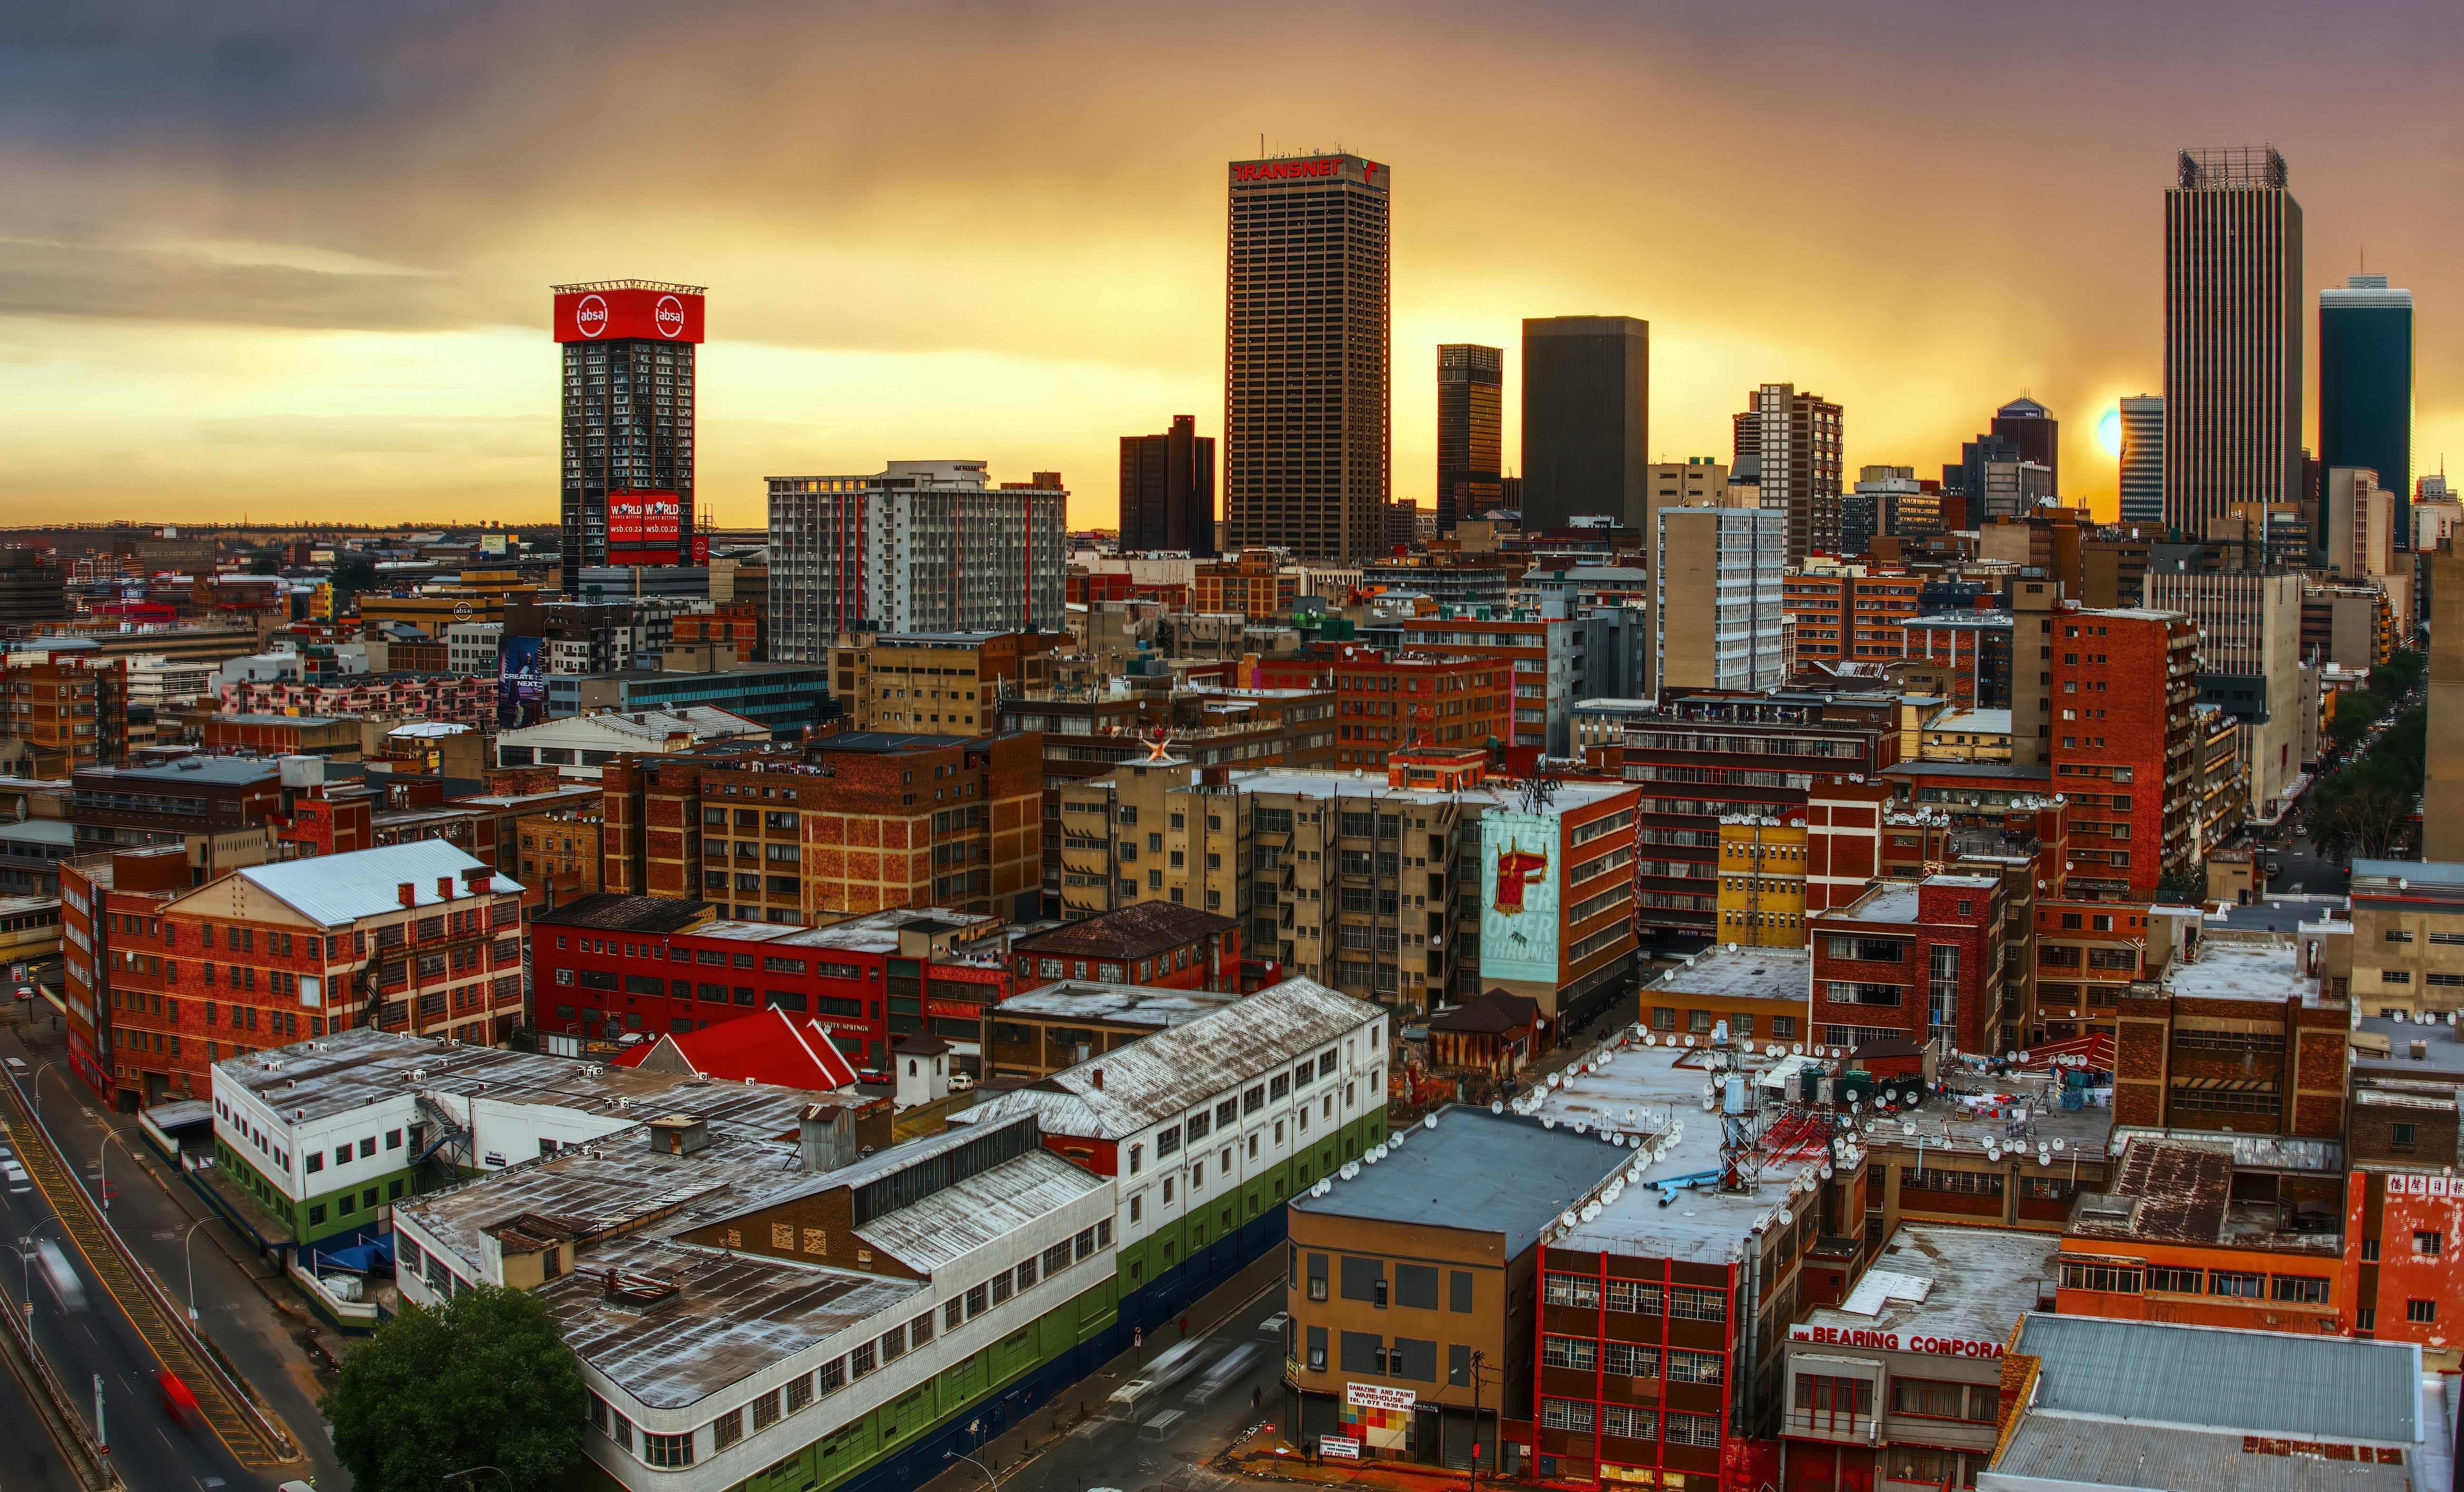
| 7 | Johannesburg | 74.2% | Medium |
| 8 | Mangaung (Bloemfontein) | 64.9% | High |
| 9 | Polokwane | 62.3% | High |
| 10 | Msunduzi (Pietermaritzburg) | 59.8% | High |
| 11 | Rustenburg | 57.6% | High |
| 12 | Matjhabeng (Welkom) | 52.4% | High |
(Scores and rankings based on 2023 Blue Drop Report data.)
Key takeaways from the data
Leaders in quality
Cape Town and eThekwini top the list, with near-perfect microbiological and chemical compliance. These cities have invested heavily in monitoring systems and infrastructure upkeep.
The mid-tier majority
Cities like Tshwane, Ekurhuleni, and Johannesburg meet most national standards but have pockets of non-compliance — often linked to older infrastructure or inconsistent chlorination.
High-risk red zones
Mangaung, Polokwane, Msunduzi, Rustenburg, and Matjhabeng have significant compliance failures. Issues range from microbial contamination to ageing pipelines leaching rust and metals.
Why scores differ so much
Water quality differences are driven by:
- Source water – surface vs groundwater can vary in purity and mineral content.
- Treatment plant performance – efficiency, maintenance, and monitoring.
- Distribution infrastructure – older pipes can re-contaminate treated water.
- Operational consistency – budget, staffing, and governance all matter.
How this affects your home
While the Blue Drop Report measures water at the treatment plant, it doesn’t account for what happens in the pipes between the plant and your home. In older systems, water can pick up rust, sediment, and trace metals before it ever reaches your tap or shower.
If you live in a high-risk city, you may want to:
- Stay updated with your municipality’s water notices.
- Consider point-of-use filtration for drinking and shower water
- Flush taps briefly before use to clear standing water in pipes.
Find your city’s full report
We’ve summarised the Blue Drop findings for 12 major South African municipalities — complete with risk breakdowns, chemical and microbial compliance details, and practical advice for residents.